Tutorial Part 2 of 2: Implementing the Gold Layer
This is part 2 and the final tutorial on crafting a medallion architecture in Microsoft Fabric Lakehouse. If you haven’t read part 1 of this tutorial yet, please refer to my previous post- Crafting a medallion architecture in Microsoft Fabric Lakehouse Part 1 of 2. In our first tutorial we covered the bronze and the silver data layers in a Fabric Lakehouse.
As a quick recap, in the bronze layer we stored all our raw csv files and in the silver layer, we loaded new delta tables into our lakehouse with data from the raw csv files. Then we defined data schema for the tables and added fields to the table as part of the data transformation. Take a look at the medallion architecture again. Now that you are up to speed. Let’s complete our little tutorial.

Transform data for Gold layer
In this layer, we aggregate our data, model it up, and make it ready for consumption by various end points like analytics, ML, or data science. In this tutorial we will only cover the analytics endpoint with Power BI.
- From your lakehouse, create a new Notebook and let’s call it Transform data (gold layer). Make sure to associate your lakehouse with your new notebook.

- Remove the existing boilerplate text from the notebook and add codes to load all tables from the silver layer into the notebook’s data frame.
- In this gold layer, we will aggregate our sales_pipeline data and create a new dimension table dimdate_gold. We create this delta table to store all the date values from sales_pipeline table, transformed to Day, Month, and Year values. In this step we are transforming the close_date and engage_date field values.
- Let’s make sure that there are no null values and no duplicates in the dimdate_gold delta table.
- Finally, let’s add all dataframes into the lakehouse as delta tables. This will mark as the final step in our gold layer.
Code Snippet
#Load all tables to multiple dataframes as a starting point to create the gold layer
df= spark.read.table("CRM_Sales.account_silver")
df1= spark.read.table("CRM_Sales.silver_products")
df2= spark.read.table("CRM_Sales.silver_sales_pipeline")
df3= spark.read.table("CRM_Sales.silver_sales_teams")
df4= spark.read.table("CRM_Sales.silver_data_dictonary")

# Define the schema for the gold_dates table
from pyspark.sql.types import *
from delta.tables import*

DeltaTable.createIfNotExists(spark) \
     .tableName("CRM_Sales.gold_dates") \
     .addColumn("DateID", DateType()) \
     .addColumn("Day", IntegerType()) \
     .addColumn("Month", IntegerType()) \
     .addColumn("Year", IntegerType()) \
     .execute()

from pyspark.sql.functions import col, dayofmonth, month, year, date_format

# Transform close_date
dfgold_dates = df2.dropDuplicates(["close_date"]).select(
    col("close_date").alias("DateID").cast(DateType()),
    dayofmonth("close_date").alias("Day"),
    month("close_date").alias("Month"),
    year("close_date").alias("Year"),
)

# Transform engage_date
dfgold_dates2 = df2.dropDuplicates(["engage_date"]).select(
    col("engage_date").alias("DateID").cast(DateType()),
    dayofmonth("engage_date").alias("Day"),
    month("engage_date").alias("Month"),
    year("engage_date").alias("Year"),
)


# Combine the results
dfgold_dates = dfgold_dates.union(dfgold_dates2)

# Sort the combined DataFrame by DateID
dfgold_dates = dfgold_dates.orderBy("DateID")

# Drop duplicates from the combined DataFrame
dfgold_dates = dfgold_dates.dropDuplicates(["DateID"])

# Drop rows with null values
dfgold_dates = dfgold_dates.na.drop()

# Display the first 10 rows of the DataFrame after removing duplicates and null values
display(dfgold_dates.head(10))

# Save all your DataFrames as Delta tables
dfgold_dates.write.format("delta").mode("overwrite").saveAsTable("CRM_Sales.gold_dates")
df.write.format("delta").mode("overwrite").saveAsTable("gold_account")
df1.write.format("delta").mode("overwrite").saveAsTable("gold_products")
df2.write.format("delta").mode("overwrite").saveAsTable("gold_sales_pipeline")
df3.write.format("delta").mode("overwrite").saveAsTable("gold_teams")
df4.write.format("delta").mode("overwrite").saveAsTable("gold_data_dictonary")
Now, let’s take a look at our lakehouse explorer and see what we have in store for us:
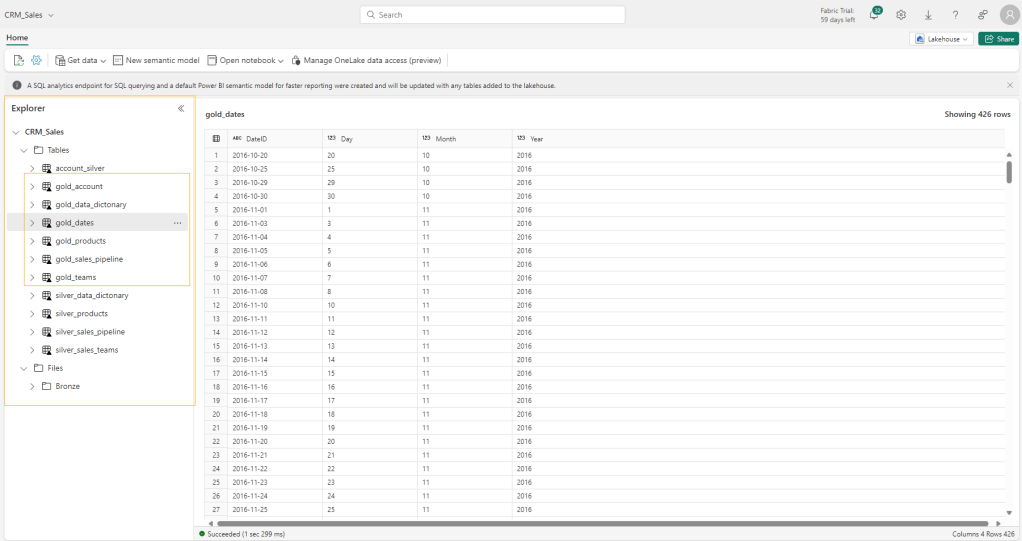
You can see that the explorer has now all the delta tables that we created as part of the gold layer transformation in the lakehouse, including the dimension table we created for all the dates from the sales_pipeline table. As we had staged these tables for a data visualization project, these delta tables are ready to be loaded into Power BI using direct lake mode.
Let’s create a semantic model
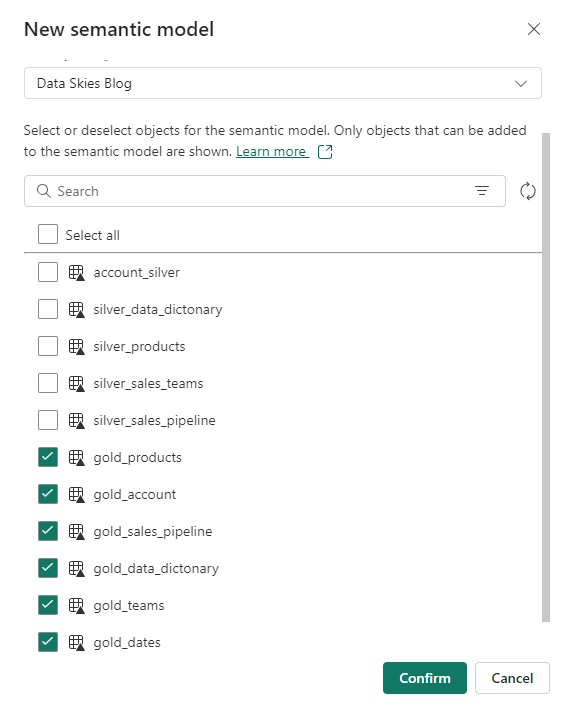
Since, we have been using the same lakehouse for our tutorial, the default semantic model would have all our silver and gold layer tables. So let’s create our own semantic model. Navigate to the lakehouse explorer and select New semantic model from the top ribbon. If you come across an error ‘Get Unexpected error when creating semantic model of a lakehouse table’, please make sure to review this article for a solution to this error. Now, let’s call this new model as BI Gold and add transformed gold tables to this model.
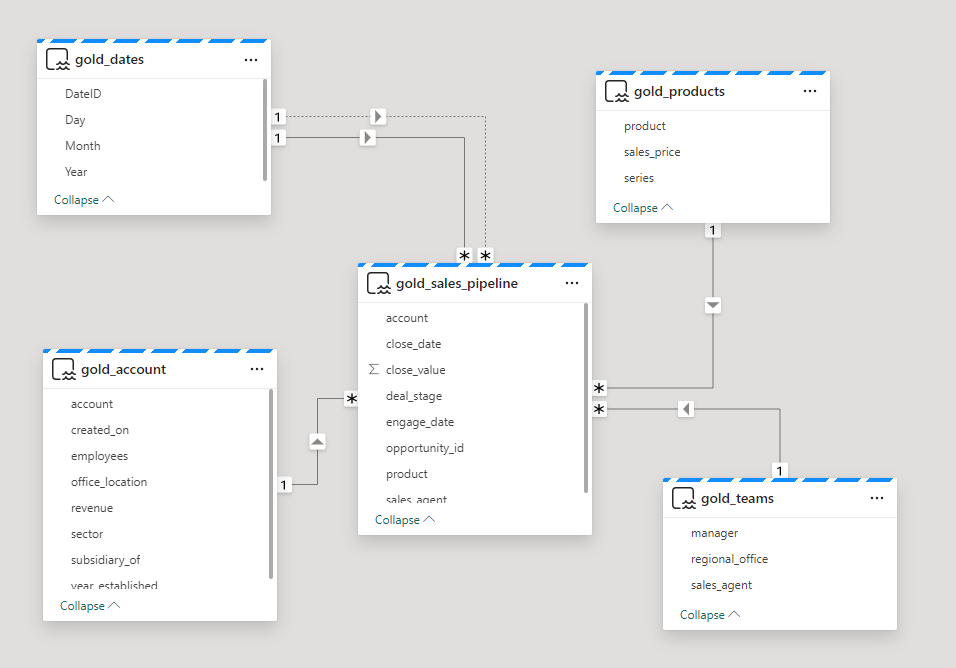
Let’s create a star schema with the fact and dimension tables, and add all relationships to the new semantic model.
Auto-Create a report
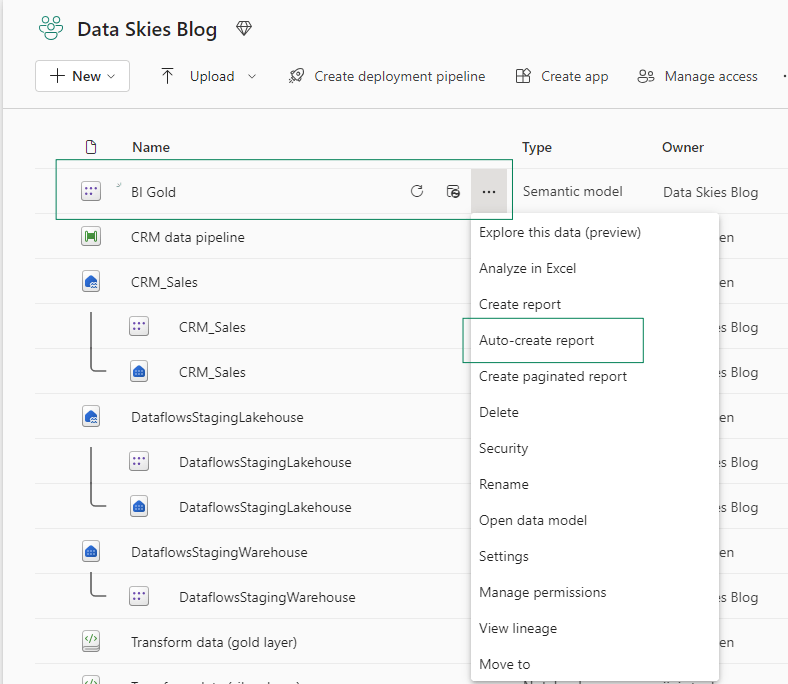
Ok now it’s time for us to visualize and report on this model. I am going to show you something very cool today in Fabric. In Fabric, once a semantic model is created, it lets you automatically create a report based on the data you select for your report. Let’s see how.
- First, you select the Auto-create report option from the semantic model options.
- You pre-select your data while Fabric generates a report for you.

- Chose more columns, modify your filters or change your visuals on this auto-generated report to fit your own needs.
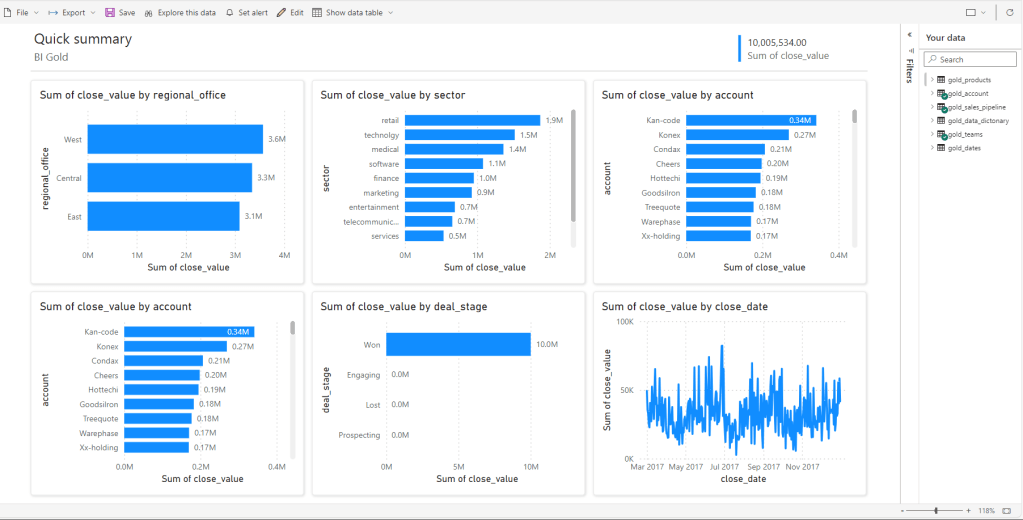
And just like that you have a report made out of your semantic model. You can change these visuals just by clicking on any desired columns that you would like to see in the report and Fabric will do all the heavy lifting for you. Isn’t this really cool!
So, why craft a medallion architecture?
Well now that you know how to craft a medallion architecture, let’s think back on this tutorial series and see why one should choose a medallion architecture when implementing a data science or a data analytics project in Fabric. When we start with data ingestion, the bronze layer, it is important that we store the raw files in one location. So, every time this dataset is needed for a project, data engineers can extract and load it into their own respective workspace or notebook. Same applies to the silver layer tables, since all the tables were loaded and transformed in delta format, our raw files or data remain untouched and hence it becomes accessible to other data users. Silver layer delta tables act as staging tables before becoming the final version of the ingested data where scientists and analysts apply their respective transformations. Depending on how your data structure and it’s integrity is, users can choose to load data from silver or gold layers to set up their own endpoints or models. You achieve efficient implementation of ETL, easier maintenance of your data platform, less load on your resources and data team, and ultimately reduced costs when an organization implements a “Medallion Data Architecture”.
Hope you have found this article insightful. And, I will see you in the next one 🙂
For any questions or advice, feel free to reach out to me on LinkedIn.

Leave a comment